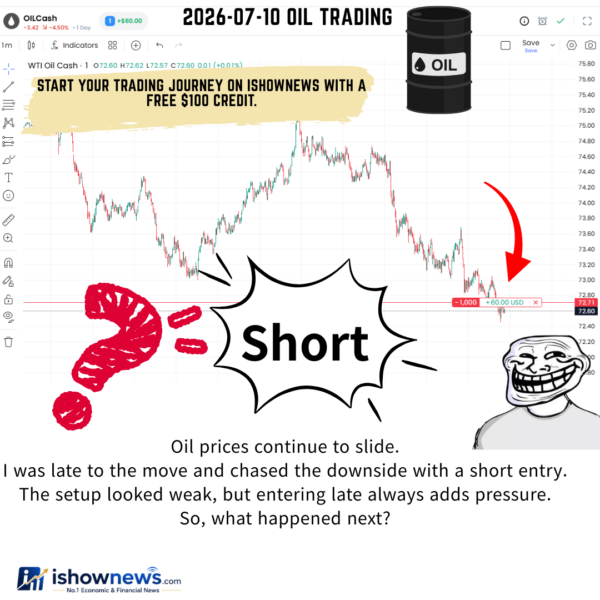
Oil trading is not only about predicting whether the price will rise or fall. One of the most important skills is reading the chart and understanding how market momentum continues after a trend has already formed.

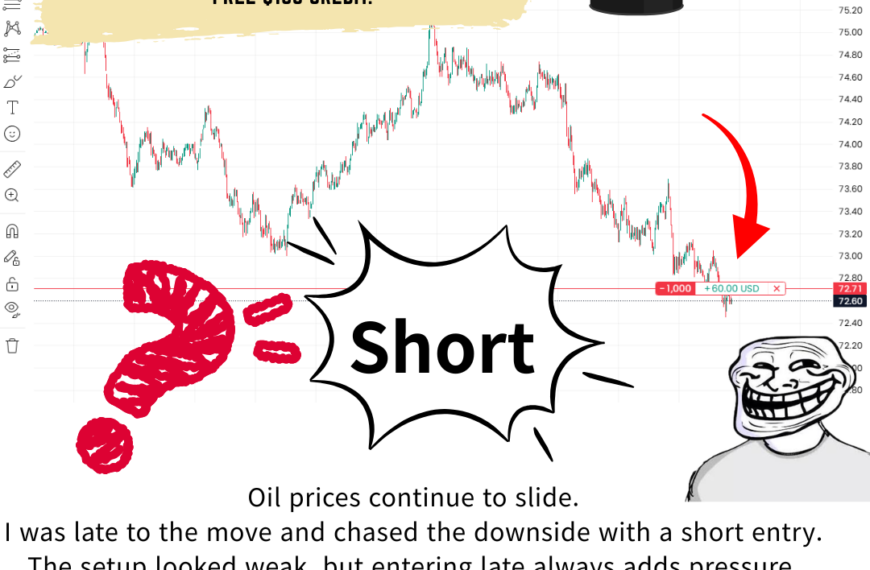
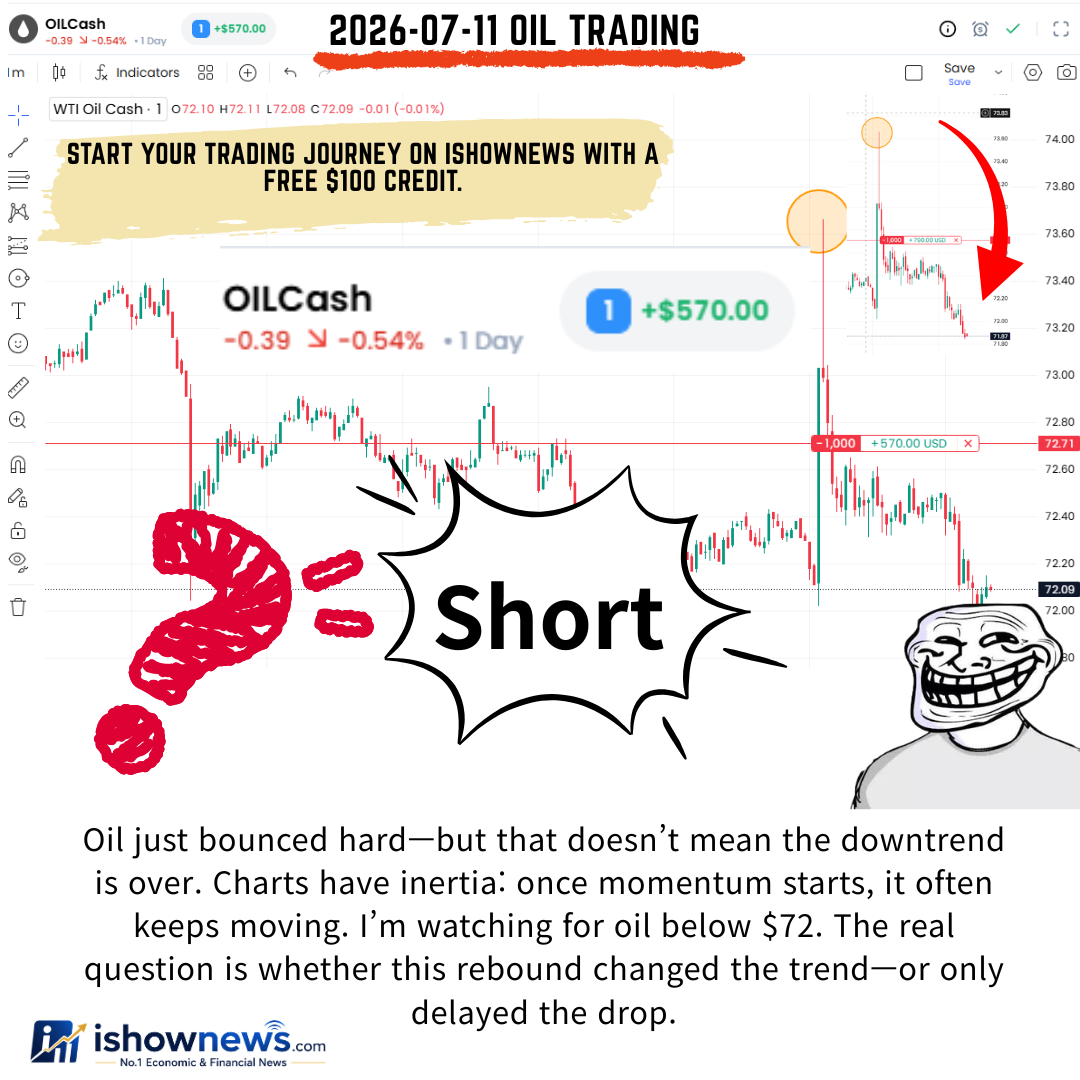
Oil recently showed a powerful rebound, but a strong recovery does not always mean that the bearish trend has ended. The rebound may instead be a temporary correction before the price resumes its previous direction. Based on the current chart structure, I expect oil to move below the $72 level.
This price behavior can be explained through the concept of market inertia. In physics, an object in motion tends to continue moving in the same direction unless an outside force changes it. Financial markets often display similar behavior. Once buyers or sellers establish strong momentum, the trend can continue until major news, liquidity, trading volume, or a technical breakout creates enough pressure to reverse it.
Traders can identify this momentum by studying lower highs, lower lows, support and resistance levels, trading volume, and the strength of each rebound. When oil rises sharply but fails to break an important resistance level, the rebound may be a correction rather than a true reversal.
In the current oil chart, the powerful rebound could have been part of the broader move toward $72. The key lesson is that traders should not judge the market only by the size of a rebound. They must examine whether the chart structure has actually changed.
Understanding chart trends and market inertia can help traders avoid entering too early, distinguish a temporary correction from a reversal, and manage risk more effectively.