In the midst of widespread recession fears, a savvy trader spotted a lucrative opportunity in the gold market. While others were fixated on economic downturn predictions, he focused on the chart, identifying a promising trend. By employing a contrarian strategy backed by technical analysis, he made a significant profit.
This trader’s success story highlights the importance of independent thinking and careful analysis for traders in the market. It demonstrates that gold can behave counter-intuitively during economic uncertainty, creating opportunities for those who can read the signals correctly.
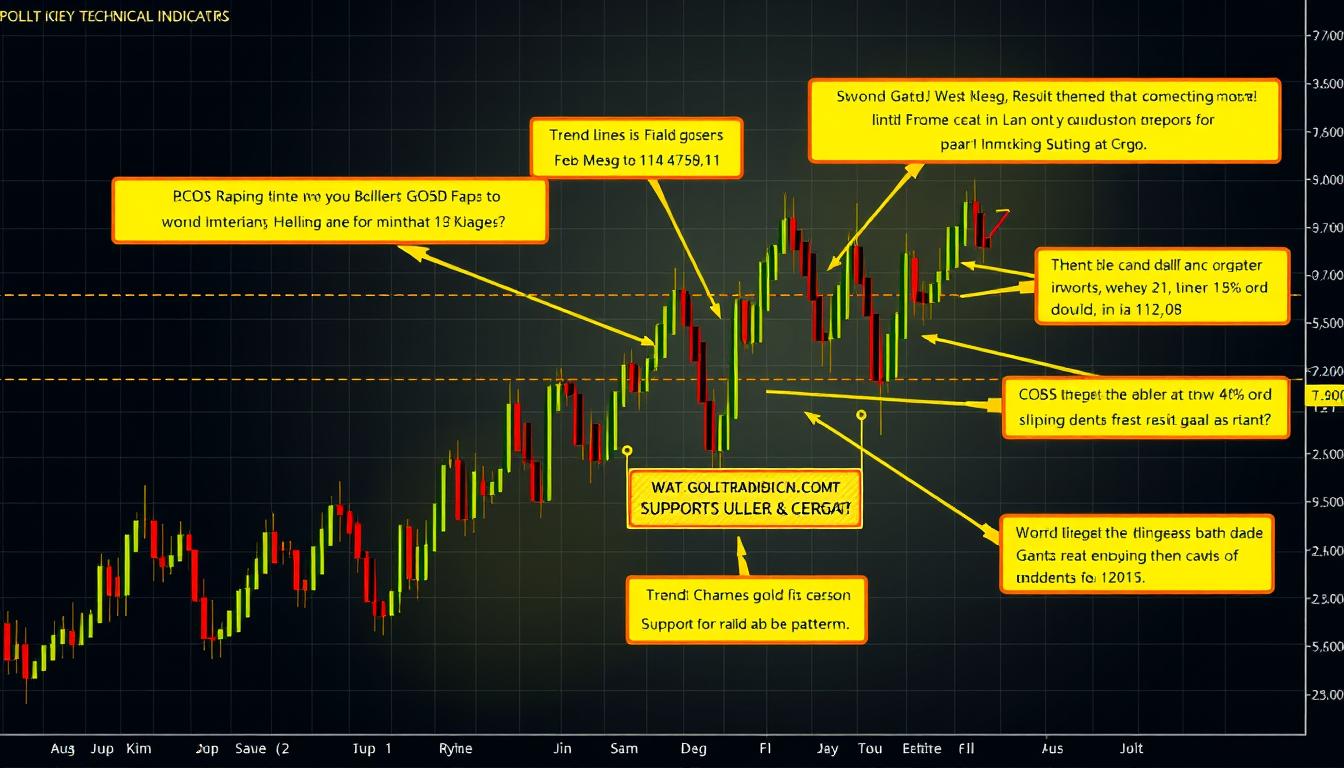
The recent market conditions presented a profitable gold trading opportunity, as the price moved slightly higher after testing a key support zone. Successful traders must combine technical analysis skills with the psychological discipline to act against prevailing narratives.
Key Takeaways
- Contrarian thinking can lead to significant profits in the gold market.
- Technical analysis is crucial for identifying lucrative trading opportunities.
- Reading charts independently is key to successful trading.
- Gold often behaves counter-intuitively during economic uncertainty.
- Combining technical skill with psychological discipline is essential for traders.
Understanding Gold’s Relationship with Economic Uncertainty
Understanding how gold reacts to economic uncertainty can provide valuable insights for traders. The recent low in gold prices has sparked buying interest, suggesting that market participants are positioning for longer-term upside, especially near technical inflection points.
Gold’s historical performance during economic downturns offers a unique perspective on its role as a safe-haven asset. When recession talks dominate the financial landscape, investors often seek refuge in gold, driving up its price.
Why Gold Becomes a Safe Haven During Recession Talks
During economic uncertainty, gold tends to attract investors looking for a stable store of value. This phenomenon is rooted in gold’s perceived safety and its historical performance during times of financial stress. As market sentiment turns bearish, gold’s appeal grows, often leading to increased demand and higher prices.
| Economic Indicator | Impact on Gold | Market Sentiment |
|---|---|---|
| Recession Fears | Increased Demand | Bearish |
| Economic Growth | Reduced Demand | Bullish |
| Inflation Concerns | Increased Demand | Neutral/Bearish |
The Contrarian Approach to Market Sentiment
Adopting a contrarian strategy involves going against prevailing sentiment. In the context of gold trading, this means identifying situations where market sentiment has become overly bearish or bullish, potentially signaling a reversal. Contrarian traders look for signals that the majority of the market is wrong, often using this as a basis for their trading decisions.
By understanding the dynamics between gold, economic uncertainty, and market sentiment, traders can better navigate the complexities of the gold market and potentially capitalize on contrarian opportunities.
The Anatomy of a Gold Long Setup
Understanding the anatomy of a gold long setup is crucial for traders looking to capitalize on market opportunities. A comprehensive analysis of technical indicators and market sentiment is essential for identifying profitable trades.
Key Technical Indicators for Gold Trading
Technical indicators play a vital role in identifying potential entry and exit points in gold trading. Moving averages and Relative Strength Index (RSI) are among the key indicators used by traders to gauge market sentiment and potential price movements.
For instance, a golden cross occurs when the 50-day moving average crosses above the 200-day moving average, signaling a potential bullish trend. Conversely, a death cross indicates a bearish trend.
Identifying Support and Resistance Zones
Identifying support and resistance zones is critical for determining the potential direction of gold prices. These zones are areas where the price has historically found it difficult to break through or has bounced back from.
Support levels, such as the $3167 level mentioned earlier, are crucial as they can prevent the price from falling further. On the other hand, resistance levels can cap the price upside. Fibonacci retracement levels are often used to identify these zones, with levels such as 61.8% being particularly significant.
The concept of support/resistance role reversal is also important, where previous resistance becomes support after a breakout, and vice versa. Traders also watch round numbers like $3000 or $3200 as they often act as psychological support or resistance levels.
By understanding these technical aspects, traders can better navigate the gold market and make more informed decisions.
Reading Market Sentiment: Beyond the Headlines
To navigate the complexities of gold trading, it’s essential to look beyond the headlines and understand the underlying market sentiment. Market sentiment plays a crucial role in determining gold prices, and being able to gauge it accurately can provide investors with a strategic edge.
Distinguishing Between Market Noise and Genuine Signals
The gold market is often influenced by a mix of market noise and genuine signals. Market noise refers to the random, meaningless fluctuations in gold prices that can be triggered by news headlines or market rumors. On the other hand, genuine signals are indicators that reflect the true market sentiment and can be used to make informed investment decisions.
To distinguish between market noise and genuine signals, investors can monitor the Commitment of Traders (COT) reports. These reports provide valuable insights into how commercial and non-commercial traders are positioned in gold futures, helping investors to gauge the overall market sentiment.
How Institutional Investors Position in Gold Markets
Institutional investors, including central banks and hedge funds, play a significant role in shaping the gold market. Their investment decisions can influence gold prices and market trends. By analyzing the ETF holdings of gold and central bank gold purchases, retail traders can gain insights into institutional sentiment and potential price direction.
| Indicator | Description | Impact on Gold Price |
|---|---|---|
| COT Reports | Provides insights into trader positioning in gold futures | Helps gauge market sentiment |
| ETF Holdings | Reflects institutional investment in gold | Influences price direction |
| Central Bank Purchases | Indicates central bank demand for gold | Can drive long-term price trends |
As Saxo Bank’s Ole Hansen noted, improved risk appetite could reduce gold’s immediate appeal as a haven, though long-term investors continue to accumulate on weakness. By understanding how institutional investors position themselves in the gold market, retail traders can align their strategies with the prevailing market trend.
Technical Analysis Tools for Gold Trading Success
Gold trading success often hinges on the effective use of technical analysis tools, which provide valuable insights into market dynamics and trend direction. These tools enable traders to make informed decisions by analyzing historical price data and identifying patterns that can predict future price movements.
Fibonacci Retracement Levels in Gold Trading
Fibonacci retracement levels are a popular technical analysis tool used to identify potential support and resistance zones in gold markets. By applying Fibonacci ratios to price swings, traders can anticipate where the price might reverse or consolidate. This helps in planning strategic entry and exit points for gold trades.
Moving Averages and Momentum Indicators
Moving averages and momentum indicators are crucial for understanding trend direction and strength in gold trading. Moving averages, such as the 50-day and 200-day MA, help smooth out price data to identify the overall trend. Momentum indicators like the Relative Strength Index (RSI), Stochastic Oscillator, and MACD (Moving Average Convergence Divergence) provide insights into the velocity of price movements, helping traders gauge the strength of the trend and potential reversals.
For instance, when the period-14 RSI approaches the neutral 50 level, it can be a significant signal. A bounce from this level could indicate that bullish momentum remains intact, potentially leading to a short-term recovery in gold prices. Combining moving averages with momentum indicators can enhance the accuracy of trend analysis and help traders identify optimal entry points for long positions.
Effective use of these technical analysis tools involves understanding how to interpret their signals. For example, the crossover of short-term and long-term moving averages can signal a change in trend direction. Similarly, divergence between price action and momentum indicators can be an early warning sign of a potential trend reversal.
By mastering these technical analysis tools, gold traders can improve their ability to navigate complex market conditions and make more informed trading decisions.
Case Study: The Recent Gold Market Correction
Contrariantraderssaw thegoldmarket correction as a potential buying opportunity, driven by their analysis ofmarket sentimentand technical indicators. This zone will be critical for determining whether the broader bullish structure remains intact. Ifpriceholds at this level and shows signs of reversal, it may present a strong re-entry opportunity for buyers.
The Technical Setup That Signaled a Buying Opportunity
The technical setup for a buying opportunity was characterized by a convergence of support levels and bullish reversal patterns.Traderswho were monitoring thegoldmarket closely identified this zone as critical for the broader bullish structure. The presence of a strong support level, combined with signs of buying interest, signaled a potential reversal.
How Contrarian Traders Capitalized on the Pullback
Contrariantraderscapitalized on the pullback by employing specific entry techniques, including limit orders at key support levels and scaling-in approaches. They managedriskduring the correction through stop placement strategies and position sizing relative to account size. By waiting for confirmation signals before entering thetrade, these traders avoided premature entries that often led to unnecessary losses. As themarketsentiment indicators and news flow were interpreted, contrarian traders filtered signal from noise, making informed decisions. The results of these contrariantrades were significant, with favorable risk-reward ratios achieved as themarketreversed higher.
The experience of contrarian traders during the recentgoldmarket correction highlights the importance of a well-thought-out strategy and the ability to remain disciplined in the face ofmarket volatility. By understandingmarketdynamics and maintaining a contrarian perspective,traderscan capitalize on opportunities presented by corrections, ultimately achieving success in their trading endeavors.
Risk Management Strategies for Gold Long Positions
A well-thought-out risk management strategy is the backbone of successful gold trading. With the inherent volatility of the gold market, traders must be equipped with the right tools and knowledge to manage their exposure effectively. In this section, we’ll explore key risk management strategies for gold long positions, focusing on setting appropriate stop-loss levels and position sizing.
Stop-Loss Strategies
Setting appropriate stop-loss levels is critical in limiting potential losses. A stop-loss order is an instruction to close a trade at a specific price, preventing further losses if the market moves against the trader. For gold trading, determining the optimal stop-loss level involves analyzing historical price movements and understanding current market conditions.
Traders often use technical indicators such as support levels, moving averages, and volatility measures to set their stop-loss levels. For instance, placing a stop-loss just below a significant support level can help limit losses if the price drops.
Position Sizing Methodologies
Position sizing is another crucial aspect of risk management in gold trading. It involves determining the appropriate amount of capital to allocate to a particular trade. Various methodologies can be employed, including fixed percentage risk, volatility-based sizing, and the Kelly criterion.
For example, a fixed percentage risk strategy involves risking a fixed percentage of the total account equity on each trade. This approach helps maintain consistent risk exposure across different trades.
| Account Equity | Risk Percentage | Stop-Loss Distance | Position Size |
|---|---|---|---|
| $10,000 | 2% | $50 | 4 units |
| $10,000 | 1% | $25 | 4 units |
| $5,000 | 2% | $50 | 2 units |
“The key to successful trading is to manage your risk, not to avoid it.” – Anonymous
Managing risk effectively is crucial for long-term success in gold trading. By combining appropriate stop-loss levels with prudent position sizing, traders can better navigate the complexities of the gold market.
In conclusion, effective risk management is essential for traders engaging in gold long positions. By understanding how to set appropriate stop-loss levels and manage position sizes, traders can mitigate potential losses and maximize their returns.
Step-by-Step Guide to Executing a Gold Long Trade
To successfully execute a gold long trade, traders must navigate through a series of well-planned steps. This process begins with a thorough analysis of market conditions and technical indicators.
Pre-Trade Checklist: Confirming Your Analysis
Before entering a gold long trade, it’s crucial to confirm your analysis through a comprehensive pre-trade checklist. This includes evaluating the trend and assessing the overall market sentiment. Traders should look for signs of downside exhaustion, such as bullish candlestick formations on lower timeframes, near key support levels.
Confirmation of the broader trend remaining bullish despite short-term bearish signals is essential. This involves analyzing the current market structure and identifying potential reversal points.
Entry Timing and Order Types
Timing is critical when entering a gold long trade. Traders should wait for confirmation of a reversal or a break above a significant resistance level. The choice of order type, whether it’s a limit or stop order, depends on the trading strategy and market conditions. Understanding how to use these orders effectively can help in managing risk and maximizing potential profit.
Managing the Trade and Taking Profits
Once in a gold long trade, managing the position is key to maximizing returns. This involves setting appropriate stop-loss levels and adjusting them as the trade moves in the favorable direction. Traders can use price targets based on Fibonacci extension levels to plan their profit-taking strategy. Monitoring momentum as price approaches resistance is also crucial, as weakening momentum can signal a potential reversal.
By following these steps and maintaining a disciplined approach, traders can effectively execute gold long trades and capitalize on favorable market movements.
Conclusion: Turning Market Fear into Trading Opportunity
To excel in gold trading, one must cultivate iron discipline, titanic patience, and nerves of steel, as the path to success is paved with data-driven decisions and technical analysis.
Successful gold long setups rely on a combination of technical analysis, market sentiment understanding, and risk management principles. By developing a personal trading strategy that aligns with individual risk tolerance and trading psychology, traders can turn market fear into profitable opportunities.
It’s essential to continuously refine your approach based on market feedback and data. The ongoing learning process required for gold trading mastery involves staying adaptable and focused on the trend. As market conditions evolve, the principles covered in this article will remain relevant, helping you navigate the complexities of price movements and trend analysis.
By starting small, focusing on consistent execution, and gradually building confidence through experience, you’ll be well on your way to mastering the art of gold trading, leveraging data to inform your decisions.


